By Alan AtKisson
In 2021 I donated all the copyrights and licensing agreements for the “Accelerator” – a set of tools that I and colleagues created, developed, and used around the world, over a period of nearly 30 years – to the international non-profit organization Compass Education. “Accelerator” has three main parts: (1) the Sustainability Compass for learning about key concepts, (2) an interactive workshop called Pyramid focused on planning for action and doing sustainable development, and (3) a simulation game called Amoeba for learning about making change happen (plus a few other tools). The whole package is now called the Compass Tools, or sometimes the Sustainability Tools.

In this article I recount the story of how the tools came to be – at least, as viewed from my perspective as lead innovator. To my great delight, all these tools have been adopted by many other people and have spread far and wide. So the real story of Accelerator is a lot bigger than my perspective, and a lot longer than this article can hope to cover. That bigger story is also why I believe there is a firm foundation for my hope that the life of these tools, now under new management, will continue for a long time to come, growing, developing, and supporting transformative learning and change for a sustainable world.
It All Started with an Amoeba
The story of Accelerator roughly parallels the birth and development of the modern sustainability movement. We can mark that movement’s launch with the publication of Our Common Future – the report of the United Nations’ World Commission on Environment and Development from 1987, which introduced the term “sustainable development” to the global community. Accelerator was born, or at least began to take shape, just a few years later.
In 1990, I and other friends co-founded a volunteer initiative called Sustainable Seattle. Our focus, at first, was the production of the world’s first sustainability indicators report. Was our city heading in the right direction, or not? Could we effectively combine traditional indicators, like economic growth and unemployment, with environmental and social measures? Could we show how everything had to work together, to ensure a sustainable city in the long run?
We were not aware, at the time, that this idea was pioneering. We had no clue that our process – multi-stakeholder consultation, using a systems-based approach to develop indicators that integrated social, economic, and environmental trends – would become a “standard model” and spread around the globe. We were just passionately engaged in trying to bring these new ideas, sustainability and sustainable development, to the Seattle mainstream. Creating a set of measurements and indicators to chart the region’s progress toward this new, comprehensive vision seemed like a strategic way to get started. And by being very inclusive and participatory, our process was also a strategy, designed to get other people on board and spread the word.
So it was not by accident that we focused on creating indicators, and that we involved a large group of people in that process, and that we were redefining a familiar management concept (“what gets measured gets managed”). Our choice of project focus was influenced by something called the Amoeba.
At one of our first organizing meetings, I passed around an article I had recently published, about a new simulation game. The game was built around the core concepts of “innovation diffusion theory” – the science of how ideas spread. Given that sustainability was a new idea for most people, we needed to learn how to spread it. So I built a roll-playing exercise and workshop around that need, elaborating on research by Everett Rogers, the pioneering theorist of communications and innovation theory.
That simulation game, now called “Amoeba” after the visual model for organizational change that I developed around Rogers’ work (I was also building on an initial inspiration from my boss at the time, Robert Gilman), has since had a wonderful life. People have acted out the Amoeba Game roles of Innovator, Change Agent, Mainstreamer, Reactionary and more, in dozens of languages, using dozens of different scenarios. And they have used the principles embedded in the Amoeba Game to plan hundreds (maybe thousands) of change initiatives.

The Amoeba Game proved to be surprisingly popular – perhaps because the Game itself embraced key principles for facilitating the spread of new ideas: it was simple, short, highly adaptable to different cultures and situations, and fun. The Amoeba made the concepts of innovation diffusion easy to grasp, quickly. It was also useful: as part of the workshop experience, people learned to build more effective strategies for positive change. (You can watch a short TED-talk about Amoeba here.)
How did the spread of Amoeba happen? 1992, I was given the opportunity to present the Amoeba Game to an international network of sustainability researchers, systems thinkers, and simulation designers, at an annual meeting in Europe of something called the “Balaton Group” (after a lake in Hungary). That experience led to a revelation: by linking the power of useful, easy-to-transfer ideas to the power of a global network of highly motivated, influential people, you can accelerate change. Sometimes rather dramatically.
My little game about spreading useful new ideas turned out to be, all by itself, a useful new idea. It started spreading. I started actively using the principles embedded in the Amoeba Game to accelerate the spread of the Amoeba Game. And that led me to wonder: could these same principles help spread the concept of sustainability?
The answer to that question was a resounding yes.
Finding – or Getting Found by – the Sustainability Compass
Parallel to all this work on innovation, the “Sustainable Seattle” initiative continued to grow. We had decided to focus on indicators of sustainability partly because – following the principles in the Amoeba model – it made sustainability quicker to understand and easier to adopt. People were already familiar with the concept of indicators from the nightly news, or from their management jobs. We were making it simple for them to embrace the new concept of sustainability, because it was attached to other concepts they were already familiar with.
We published our first report on sustainable development trends in Seattle in 1993, and the report started spreading around the world, mostly by word of mouth (usually at international conferences). Other cities took an interest. Some began copying us, both our process of multi-stakeholder engagement, and our model of defining indicators that pointed us in the direction of sustainability. I started traveling around myself, teaching people in other places how to do what we had done in Seattle – and of course, I was keenly aware that by doing so, I was in the middle of an exercise in spreading innovation. I consciously used the Amoeba concepts to help make sustainability indicators simpler, more useful, and easier to understand. I also tried to make the process of working on them more pleasurable and attractive.
As you can imagine, the process of defining measurements of sustainability can become quite technical. You have to define what to measure, analyze the data, sometimes commission new research. Then you have to take that data and turn it into effective communications, so that decision-makers and the general public can make sense of it. Complicated spreadsheets and research studies have to be translated into simple symbols: a basic chart, perhaps with some up-or-down trend-arrows (which is what we did in Seattle), maybe a system of green, yellow or red lights (which became more common later).
My work with Sustainable Seattle got me invited back to a meeting of the Balaton Group in 1994. Once again, I saw the power of networking link up with the power of important, easy-to-transfer ideas to accelerate change. Balaton members carried the Sustainable Seattle story with them into other international meetings and wrote about it in their newsletters. Word spread through other networks, too. More sustainability indicator projects sprang up – from Sustainable Pittsburgh to Sustainable Penang – and along the way I built a small consulting firm. I also got recruited to a senior position in a respected think-tank. Both jobs helped me spread the word still farther.
At the same time, the UN’s first global agreement on sustainable development (a document called “Agenda 21” from the 1992 Earth Summit) started stimulating programs at the national and local level. People wanted to translate the ideas in Agenda 21 into action, and they needed tools to do it. A wave was building.
I was part of that wave, and my work on indicators got me into a number of high-level academic and government processes, where leading researchers and officials were wrestling with big questions. One of those processes was led by Donella (“Dana”) Meadows, the famed lead author of the global bestseller Limits to Growth (1972), and a co-founder of the Balaton Group. And one of the toughest questions those researchers and officials were asking was also the most fundamental one: how do we define “sustainability”?
Dana and her colleagues (including me) ultimately decided to embrace a framework developed by a highly respected “ecological economist” named Herman Daly. Daly proposed a hierarchy: first, there is Nature. Without a healthy, well-functioning planet, you cannot have an Economy, which takes resources from Nature and produces the things humans want and need. To organize that process of economic production and distribution, you eventually get a Society: laws and institutions, peaceful ways of living and working together, educational and medical systems, etc. Finally, if all of the things in that hierarchy are working as they should be, the result is Wellbeing: happy, healthy people, leading satisfying lives.
I thought Daly’s hierarchy was a lovely idea. But there were problems. Remember, I looked at the world through an “Amoeba” lens: if you want ideas to spread quickly, you need to simplify them. You need to make them appear useful, relevant, attractive. Daly’s hierarchy might be “right” in some sense, but it looked awfully hard to communicate. I also wasn’t convinced it was fully “right”, because the connections among those four topics were much more complicated than a simple hierarchy. We needed something that would make Daly’s ideas easier to understand, but also give us a more integrated way of seeing how Nature, Economy, Society and Wellbeing all affect each other – how they all work together as a system, not as a hierarchy.
Sometimes you get an “Aha!” moment. You are stumbling around in your mind and you find an idea. Or maybe the idea finds you.

captured in a photo by Joan Davis, 1997
In 1997, in the middle of an indicator meeting convened by Dana Meadows, hosted by the Balaton Group, and sponsored by the Dutch government, someone said the word “compass”. They were referring to how indicators provide us with a sense of direction.
Huh, I thought. A compass.
North, East, South, West.
Nature, Economy, Society, Wellbeing.
Eureka!
I ran to the whiteboard, made a quick sketch, and the Sustainability Compass – using the familiar letters N, E, S and W, but giving those letters new meanings – was born. (See photo.)
Later, I and my dear friend and colleague Lee Hatcher (1949-2019) would create a way to aggregate sustainability indicators into a set of four indices – overall “scores” for Nature, Economy, Society and Wellbeing. Our model of scoring sustainability, using the Compass framework, got picked up by a few cities and has been documented in academic publications.
But it wasn’t the indicator application of Compass that proved to be the biggest impact of my little “Aha!” moment. It was the Compass itself. That simple symbol – with the familiar directions replaced by the four inter-connected aspects of sustainability that Daly originally identified – has truly lived an amazing life. The Compass helps people grasp the idea of sustainability quickly. It links the idea to a very familiar symbol for setting direction. Also, being circular, it supports a much more systemic understanding. The shape of the Compass suggests that we consider how “everything is linked to everything else.”
Today, nearly 25 years later, the Sustainability Compass is still going strong, and still spreading. In fact, a whole educational movement seems to be growing around it. I will come back to that.

(There have been many different graphic interpretations of the Compass.)
How to Build a Pyramid
By the end of the 1990s, there was Compass and Amoeba. Now I want to tell you about the third tool in this toolbox, Pyramid. I confess that Pyramid is my personal favorite, because it combines everything above, and more besides , into one dynamic group experience. And it has the potential to catalyze major initiatives – which it has done many times.
This part of the story does get a bit more complicated. So I will break it into three chunks: the background conditions in the sustainability movement at the time, the open-source method I developed for strategic planning in a sustainability context, and the birth of the Pyramid tool itself.
Then I’ll tell you (briefly) what happened next … and about my hopes for the future
The Background. Throughout the 1990s, indicators were a popular way to start grappling with sustainability. But by the end of the decade, people were more interested in doing things rather than just measuring trends. I and my colleagues – by now I had a growing firm, with offices in Seattle (USA) and my new home in Stockholm (Sweden), and a growing international network of associates and clients – were passionately interested in turning all this new knowledge about sustainability into action.
By the year 2000, there were a number of other systems in place for making indicators, some of them specialized around the special needs of cities or companies. The world was getting very good at developing measurements to tell us whether our cities, companies and nations were heading toward long-term ecological, economic, social and individual health: in a word, sustainability.
The indicators told us that mostly, we were going in the wrong direction.
So how could we facilitate and accelerate the process of moving from indicators to action? What kinds of tools did the world need, to get people thinking together, planning together, doing together? Out of that question grew a few more “Aha!” moments, as well as a shared project.
The Method. In the back of my mind, there had always been a kind of thread running through the work I was trying to do. Indicators were not an end in themselves: they provided an entry point for systems thinking, understanding how different trends were linked together in chains of cause and effect. By studying the trends and analyzing their linkages, through the lens of systems thinking, you could gain insights about where to focus your change efforts for maximum sustainability impact. After you figured out where to focus on making change, then you had to decide what to change.
Then you had to convince people to actually do it.
This thread of thinking finally came together in a speech I gave in 2000 in Portland, Oregon. Doing Indicators – mapping the significant trends – was just step one. Then came Systems analysis, using the linkages among the indicators (which have been selected to describe all the key aspects of sustainability) to find the most powerful points of intervention. The third step was Innovation, choosing the specific ideas and changes to introduce at these “leverage points” inside your company, city, school or university. Finally, you needed a Strategy for successfully introducing and implementing those changes, as part of your sustainability program.
Those four steps – Indicators, Systems, Innovation, Strategy – made a nice acronym: ISIS.

from an overhead transparency drawn in the year 2000
Well, it was nice at the time. Anybody familiar with the history of conflict in the Middle East will understand why we later had to change that acronym. So I added a “Step 0” – having a clear Vision of sustainability – and renamed it VISIS. The “VISIS Method” is now known as an open-source planning process that can be used in any sustainability context.
And it is the method I had in my head when I met Sydney Green.
Designing the Pyramid Tool. My friend Sydney had been leading a sustainability (or “healthy community”) initiative in her home city of Orlando, Florida. She saw me speak at a conference and invited me to come work on indicators for her region. By coincidence, I had grown up in Orlando. So I was very happy to say yes. Sydney and I, together with my business partner Lee Hatcher, worked on producing the first-ever Compass Indicator Report. What a joy to use my new tool for measuring sustainability in my old hometown!
Then a regional initiative in New Orleans hired me and my team to do the same thing there. I asked Sydney to join us in New Orleans, to speak about her experience in Orlando. While there, we took a walk in the city’s natural jewel, Audubon Park, together with my colleagues Lee Hatcher and Sandy Bradley.
Sydney had previously been telling me about an idea she had for her work Orlando. The idea involved engaging community members in a workshop exercise to build consensus on action. She and her colleagues thought it would be fun to actually build a physical, four-sided pyramid model, as part of the workshop, symbolizing the four aspects of community development they were focused on at the time. Perhaps they could build the pyramid in layers during the course of a community workshop. It was a beautiful germ of an idea, but they had not finished it yet.
As we sat in a gazebo in Audubon Park, talking about these things, it hit me: another Eureka! moment.
The four sides of Sydney’s community development pyramid could be replaced by the four “directions” of the Sustainability Compass.
The layers in building up the physical pyramid model could be the strategic planning process of the ISIS Method (from here on out, I will use VISIS Method).
We all got excited about this idea of blending the Compass and VISIS with a physical pyramid. We thought we were inventing a new simulation game about building a sustainable community. (As things turned out, we were inventing something much more interesting than that.)
A few months later, the four of us met again in Sydney’s rustic lakeside vacation cabin, in central Florida, to design the “Pyramid Game”. We worked out how the process would go: teams built around the Compass directions, a sequence of activities built around the VISIS Method, the pyramid growing in the center of the room. Lee, who had worked many years as a professional engineer, figured out how to construct a physical pyramid model using simple wooden ice cream sticks (later we used tongue depressors, which are larger). We added a lot of sticky notes and pens, and some slides to explain the rules. Presto, we had a prototype.
I took the prototype of the Pyramid to the next meeting of the Balaton Group (and a few other places) for testing. To make a long story short, people loved the Pyramid – but they said we had to change it. As my friend Wim Hafkamp, a leading economist in the Netherlands, put it: “This Pyramid of yours is great, but it is too serious to be a game.”
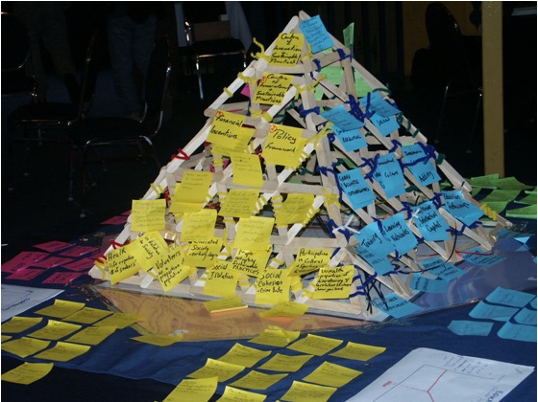
The Final Product. That is how Pyramid became a teaching and planning workshop. Over the course of one or two days, building a Pyramid takes a group of people – students or professionals – on a journey of learning and discovery, or sometimes a process of planning. They envision sustainability for their organization, community, or school. They develop simple indicators to reflect that vision, using the Sustainability Compass. They practice systems thinking with those indicators and look for what Donella Meadows called “Places to Intervene in a System” – more simply known as leverage points. Then they brainstorm ideas for specific things to change, at those leverage points. Finally, they build strategies for how to make those changes happen.
Along the way, they build a physical Pyramid, growing level by level, reflecting the four Compass directions, and recording their journey – everything from their first scattered dreams and visions of sustainability, to their growing consensus on analysis, to the capstone on the top: an agreement about the most effective actions to take.
I tested the new Pyramid workshop a few more times, wrote facilitator manuals, and we launched it with paying customers (like the US Army) and pro bono customers (like the United Nations) in 2001. At last, we had a complete package of tools. Inspired by the success of things like software packages, we even started thinking about turning it into a suite of tools, and licensing it to others.
Accelerator was born.
What Happened Next … and What I Hope will Happen
Using the Accelerator was always, for me, a joy. The package kept improving and growing. It was like having a Swiss Army Knife for professional sustainability consulting and training. And people enjoyed working with it – there were always smiles after an Amoeba Game or a Pyramid Workshop. The Sustainability Compass produced many “Aha!” moments that were always a pleasure to witness.
And the people who began gathering around the tools were a joy as well. There are too many to recount, so I will focus on just two for now: Robert Steele and Gonthong Lourdesamy. They worked with a small NGO that had gotten support from UNEP to run sustainability training programs on a converted rice barge, traveling up and down the rivers of Thailand. In 2001, UNEP contracted with my firm to use the new Pyramid workshop on the barge. Robert and Gonthong facilitated this new workshop over two days, with a group of media people from all over Southeast Asia. And they did it based only on a freshly written manual, sent by email, and a long coaching phone call with me. (At this point, I had only run the workshop myself about ten times.)
That the workshop on the rice barge was a success probably says more about Robert and Gonthong, their skill and patience, than it does about the Pyramid. That the success of that workshop led to twenty years of close collaboration with Robert (Gonthong moved on to other work a few years later), and ultimately to the founding of Compass Education, is one of the best-ever results from the use of Pyramid workshop.
But I am getting ahead of my story.

In 2002, I convened the first “Accelerator Intensive” at a retreat center near my home in Sweden. People came from Sweden, Europe, Japan, India, Australia, the US, and of course Thailand. Robert and others really learned the tools intensively there, and then they carried them – as did hundreds of other people who later went through similar training sessions – out into the world. Over two decades, Compass, Pyramid and Amoeba inspired university curricula, helped cities plan sustainability programs, and nudged companies toward the next step on their sustainability journeys, among many other things.
But it was the Sustainability Compass, sitting there at the base of the Pyramid, that really spoke to schools. It proved to be a powerful tool in the classroom – so much so that it eventually gave rise to a new, spin-off organization, powered by volunteers, and designed to transform the teaching of sustainability so that it could reach millions of teachers and students around the world.
And that is what I hope will happen next.
My fervent hope is that Compass Education – which first grew out of my firm as volunteer-driven initiative, and which then became a non-profit organization formed and nurtured by Robert Steele and his longtime associate Watkana “Nong” Thongrueng, and which has now grown into a global movement of teachers, administrators, and of course students, led by Executive Director Nicole Swedlow and a very dedicated board – will succeed. That the Accelerator will help them to succeed. Because the world needs them to succeed.
But how that happens is a story for another day – and a story for other people to tell, specifically the wonderful team at Compass Education, which now owns Compass, Pyramid, Amoeba … and a significant piece of my heart.

